Overview
The data on this site is derived from the U.S. Census Bureau Household Pulse Survey (HPS) and the U.S. Bureau of Labor Statistics Local Area Unemployment Statistics (LAUS). New HPS data is currently released every four weeks, and new LAUS data is released once a month. The most recent data used for this report are:
- Household Pulse Survey:
- Summary data: October 18 - October 30
- Complete data: October 18 - October 30
- Local Area Unemployment Statistics:
- Statewide data: September
- County-level data: September
This report updates upon the release of new data. Sign up with this form to be notified of updates. All data used in this report can be found and downloaded here. All code used to download and process the raw data and to generate this site can be found here.
If you have any feedback, comments, or suggestions for improvements to this site, please email us.
Food insufficiency
Rate over time
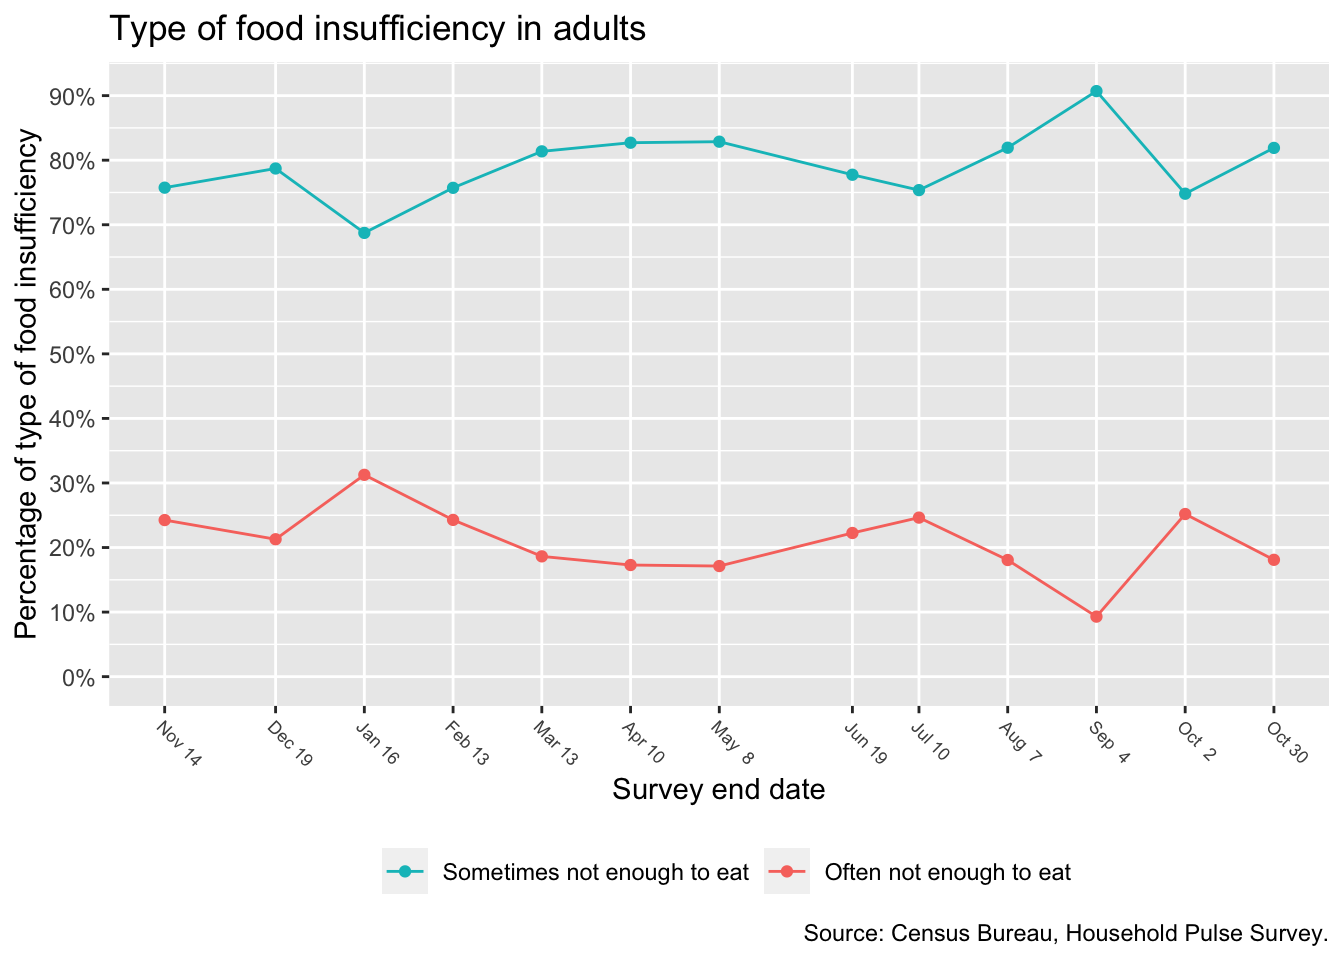
The plot below contains the percentage of adults who answered this question:
In the last 7 days, which of these statements best describes the food eaten in your household?
with one of these two answers:
Sometimes not enough to eat
Often not enough to eat
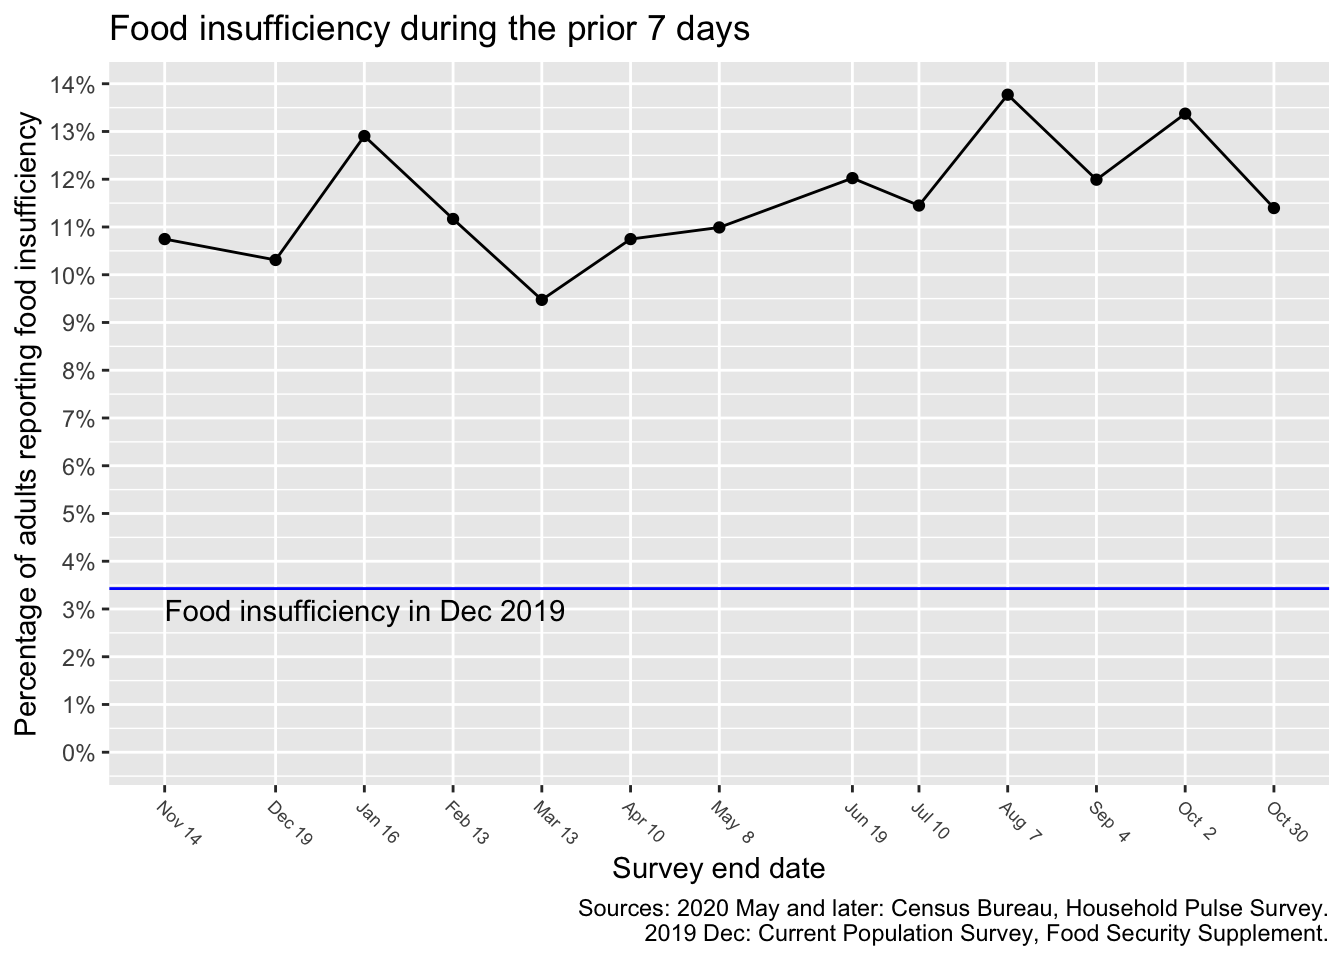
In the most recent survey period that ended October 30, an estimated 11.4% of California adults, or approximately 2,930,000 adults, lived in households with food insufficiency.
Using a model based upon data from the Food Security Supplement of the Current Population Survey, we estimate that in the most recent survey period, 9.6% of children, or approximately 835,000 children, experienced food insufficiency.
The percentages and numbers of adults in the above table are based upon those who answered the survey question on food insufficiency. Even if the percentage of adults reporting food insufficiency is the same in two surveys, the number of adults reporting food insufficiency in the two surveys could vary depending upon the number who answered the question.
Geography
The map below is for the survey period that ended October 30. Hover over a county for its food insufficiency rate.
Estimated from: Census Bureau, Household Pulse Survey.
Bureau of Labor Statistics, Local Area Unemployment Statistics.
Because the Household Pulse Survey does not provide data at the county level, we use a model to estimate the county-level food insufficiency numbers. The model uses the food insufficiency rate of California and the county unemployment rates to estimate food insufficiency for each county.
The state-level food insufficiency data is updated more frequently than the county unemployment rates, and each month’s unemployment data comes out later than the food insufficiency data. If unemployment data is not yet available for a month, the model uses the latest month for which data is available.
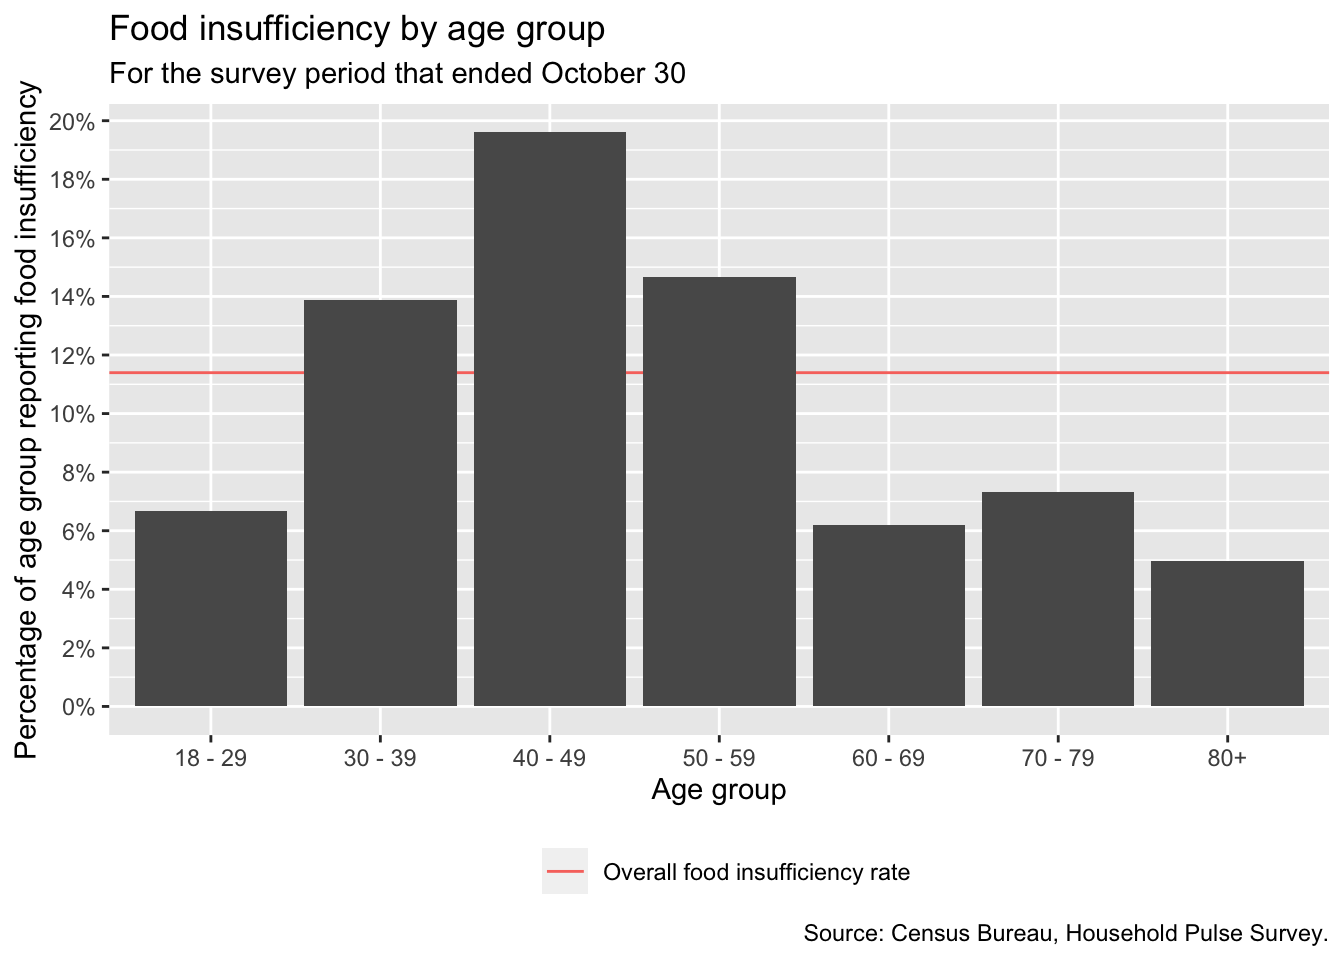
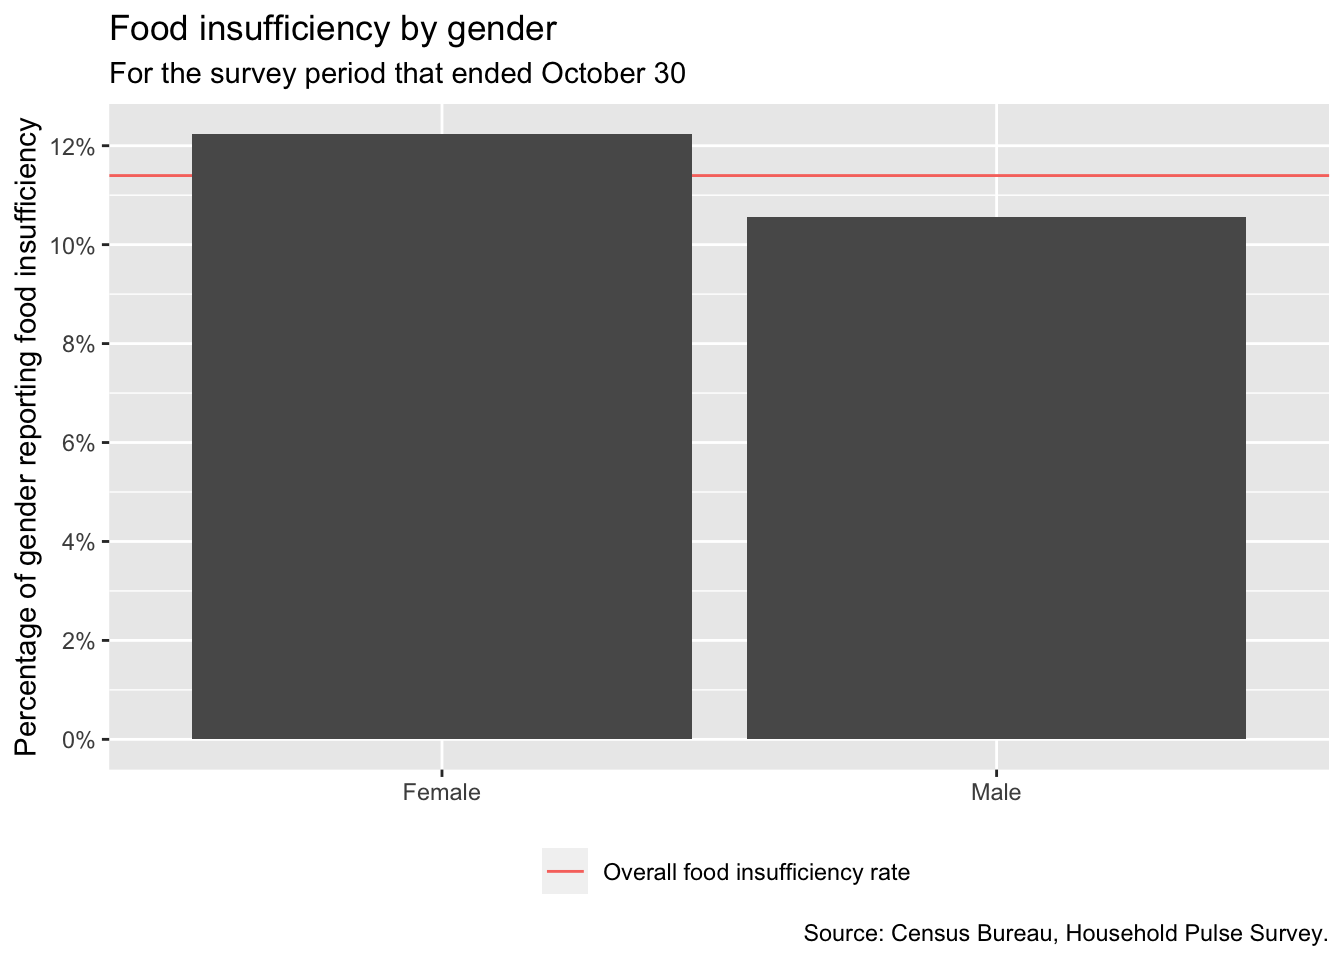
Demographics
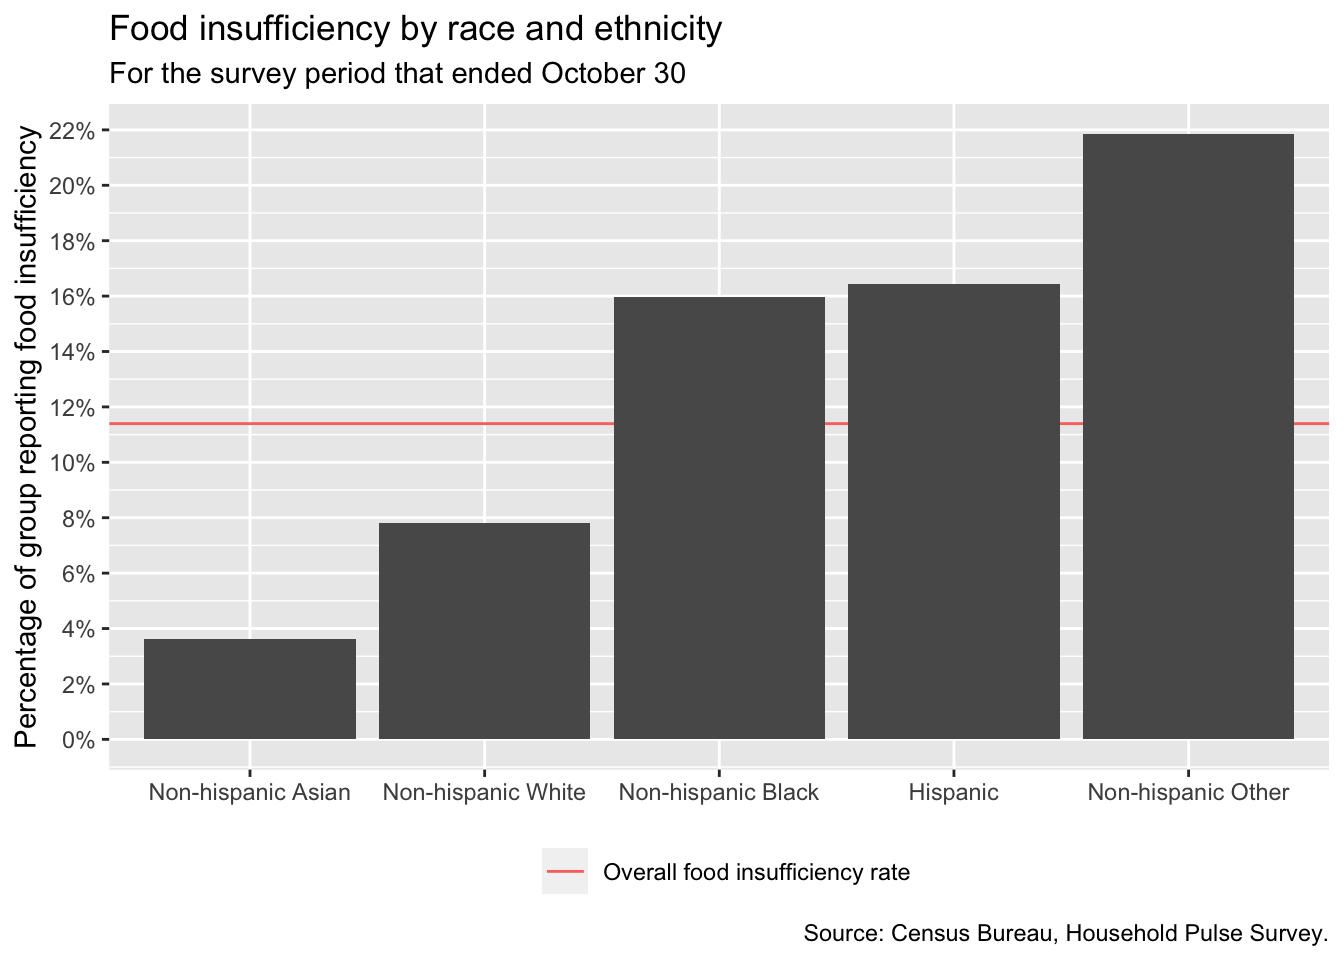
In the above, Hispanic refers to individuals of any race. White, Black, and Asian refer to individuals of that single race. Other refers to individuals of two or more races, or races other the White, Black, or Asian.
Reasons
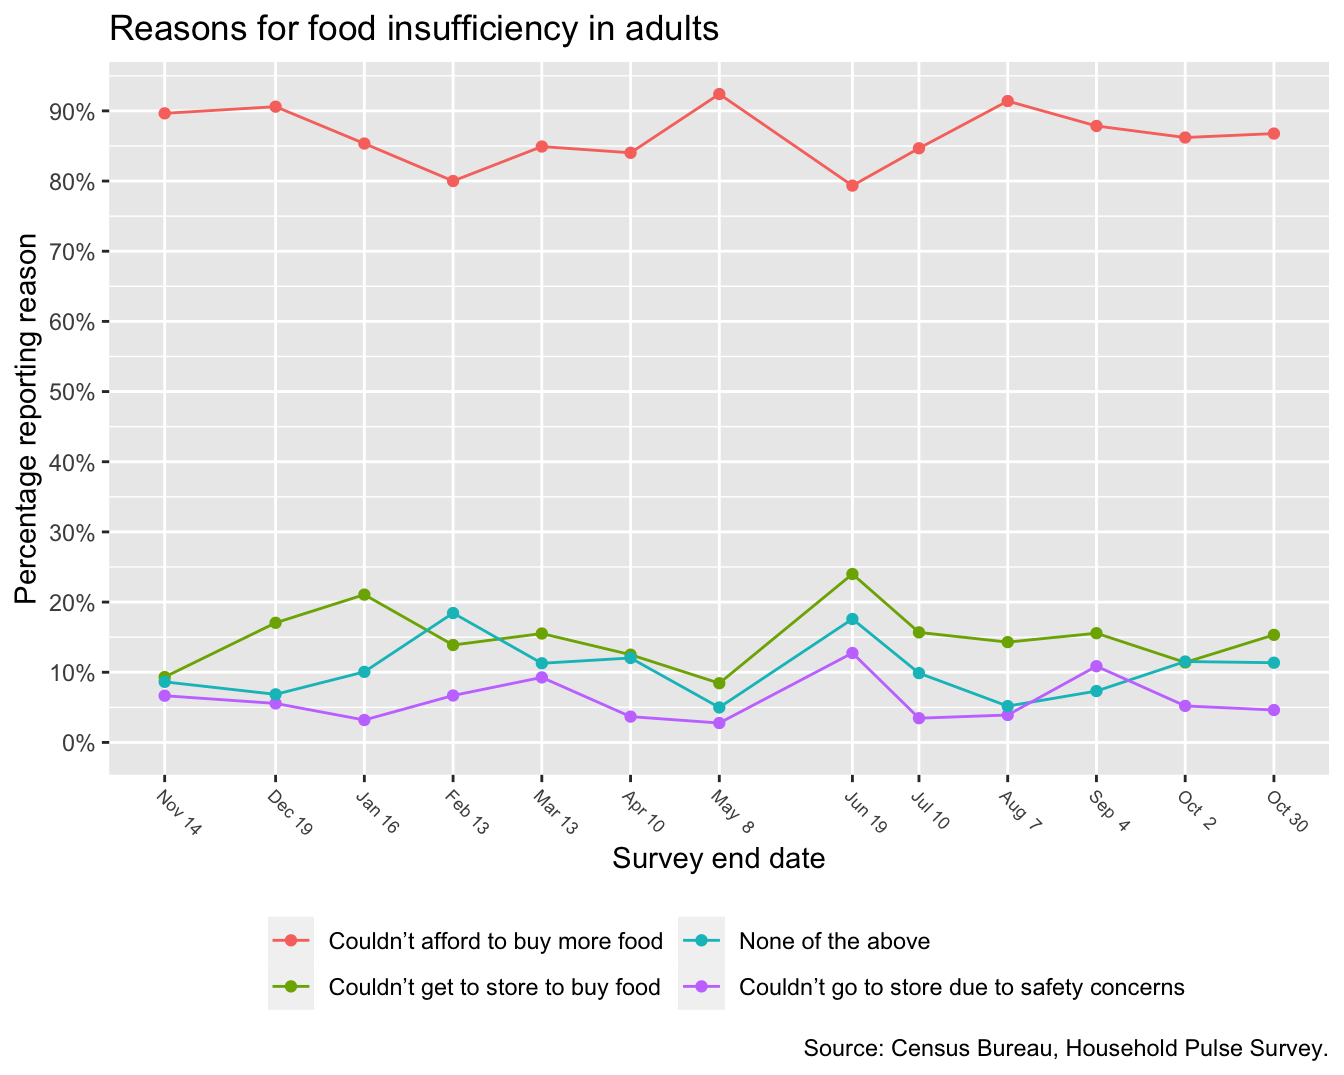
The above plot contains the reasons respondents gave for their household’s food insufficiency. Respondents can choose more than one reason, so the percentages sum to greater than 100%. This question was first asked in the survey that ended 2022 Nov 14.
Severity
Supplemental Nutrition Assitance Program (SNAP) and Special Supplementary Nutrition Assistance Program for Women, Infants, and Children (WIC)
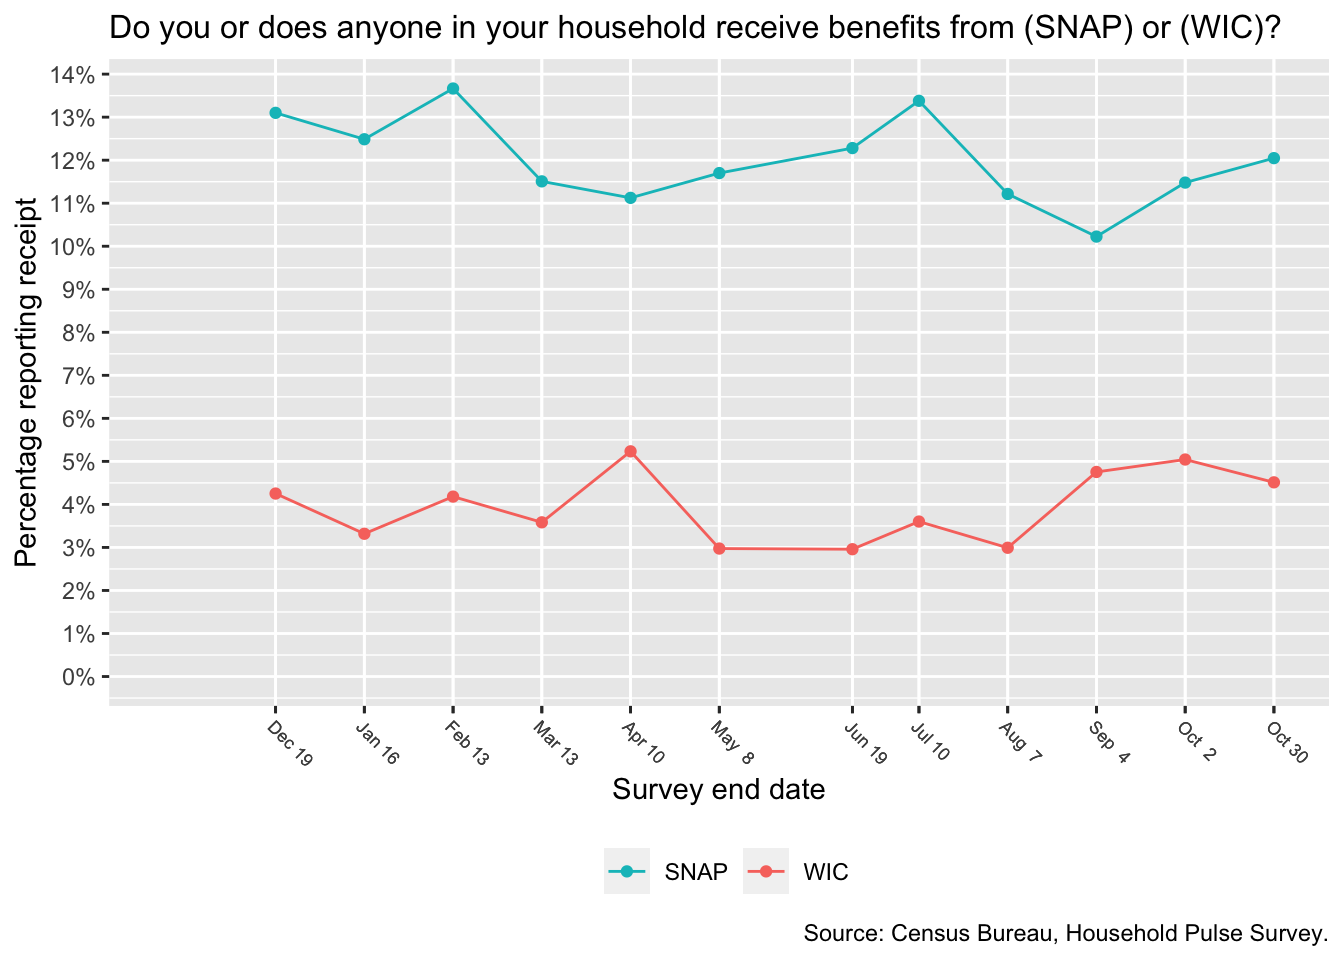
This question was first asked in the survey that ended 2022 Dec 19.
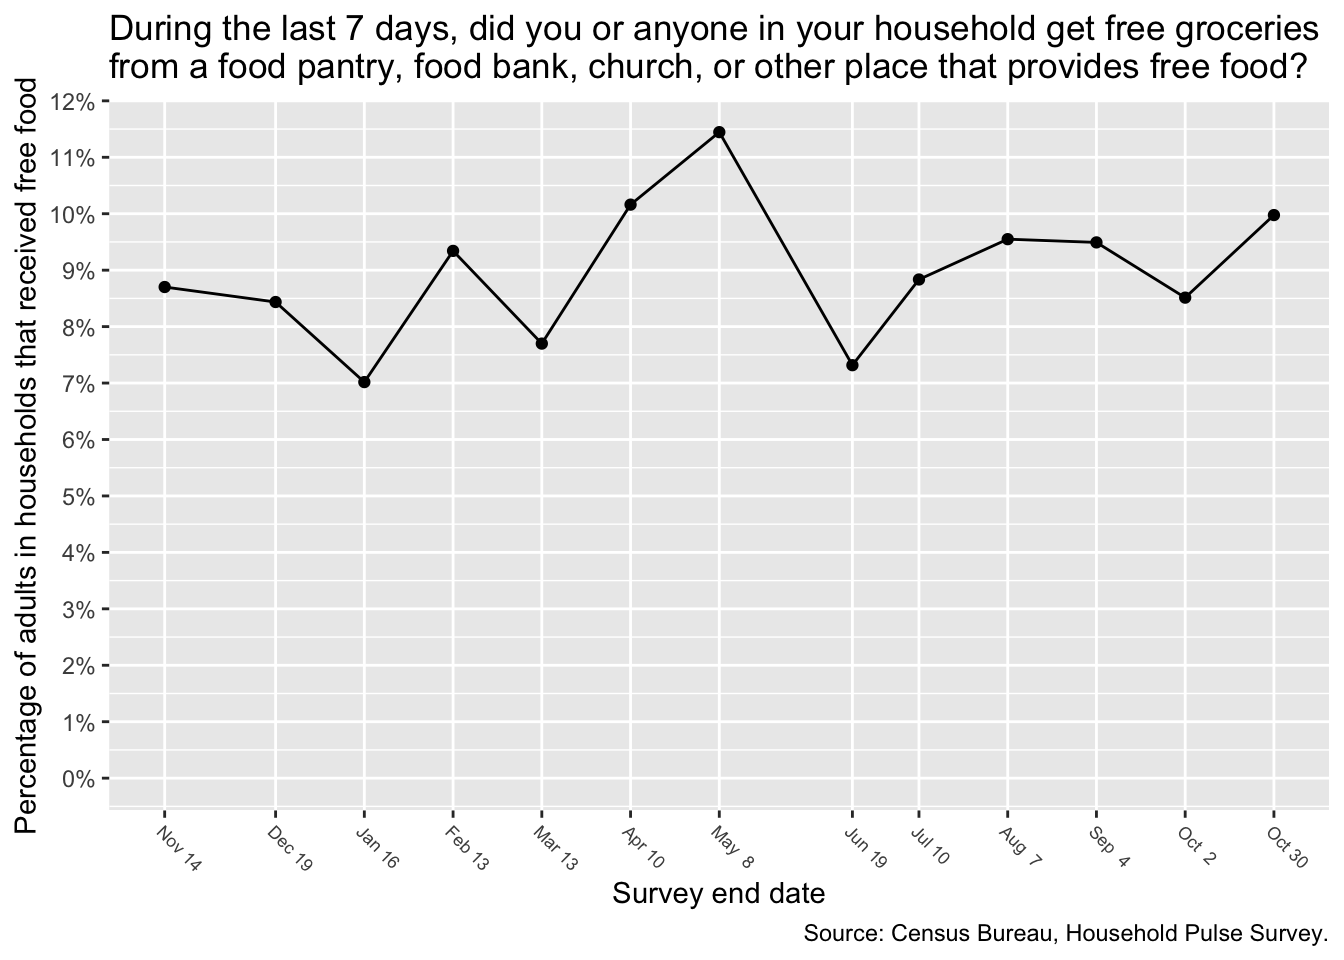
Free groceries
Unemployment
Rate over time
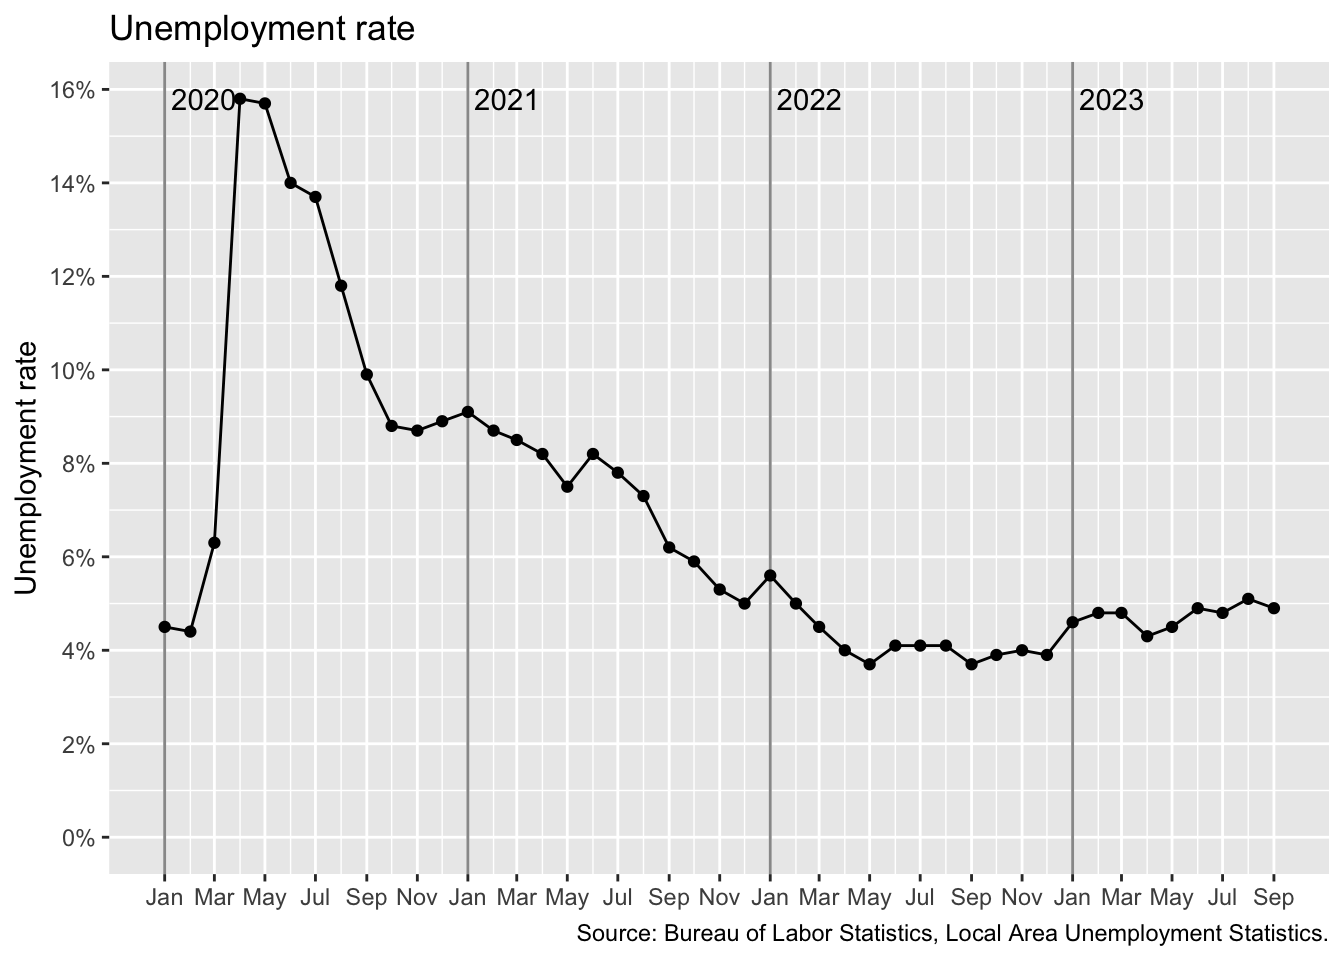
The data for the most recent month is typically “preliminary” and subject to revision when the following month’s data is released.
Geography
The map below is for September. Hover over counties for rates.
Source: Bureau of Labor Statistics, Local Area Unemployment Statistics.